
← Stories
IN BRIEF
HEALTH · HOSPITAL CAPACITY · STATES
Where are Malaysia's public-sector hospital beds?
Compare active public-sector hospital beds across Malaysian states and federal territories using Ministry of Health operational records through 2022.
SHOW ME THE DATA2015 → 2022 · public-sector hospital beds
VIEW DATA ASSame source · different visual lens
PULSEKITA RACE2015 — 2022
MOH
SourceMinistry of Health Malaysia
2015
1Perak5.8K

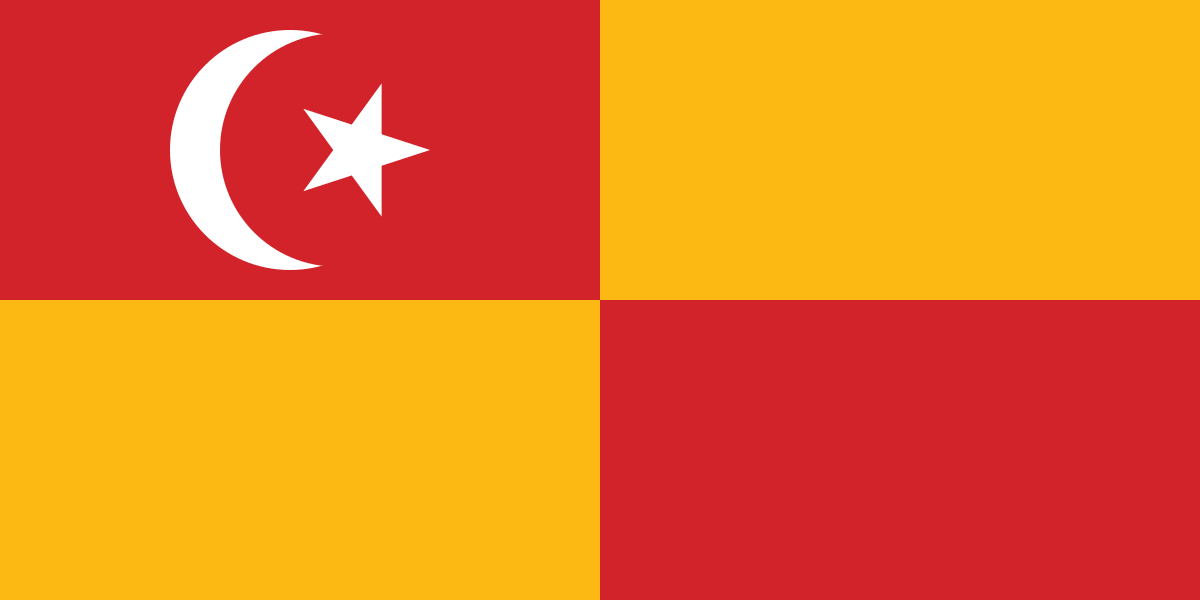
2Selangor5.5K
3Johor5.0K

4W.P. Kuala Lumpur4.9K
5Sabah4.7K

6Sarawak3.9K

7Kedah2.7K

8Kelantan2.5K

9Pahang2.2K

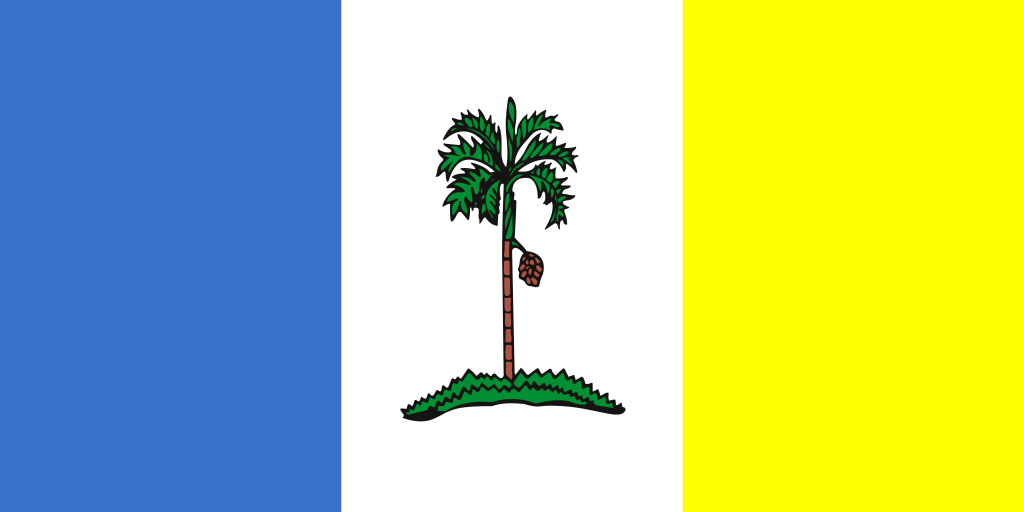
10Pulau Pinang2.0K
11Negeri Sembilan1.8K

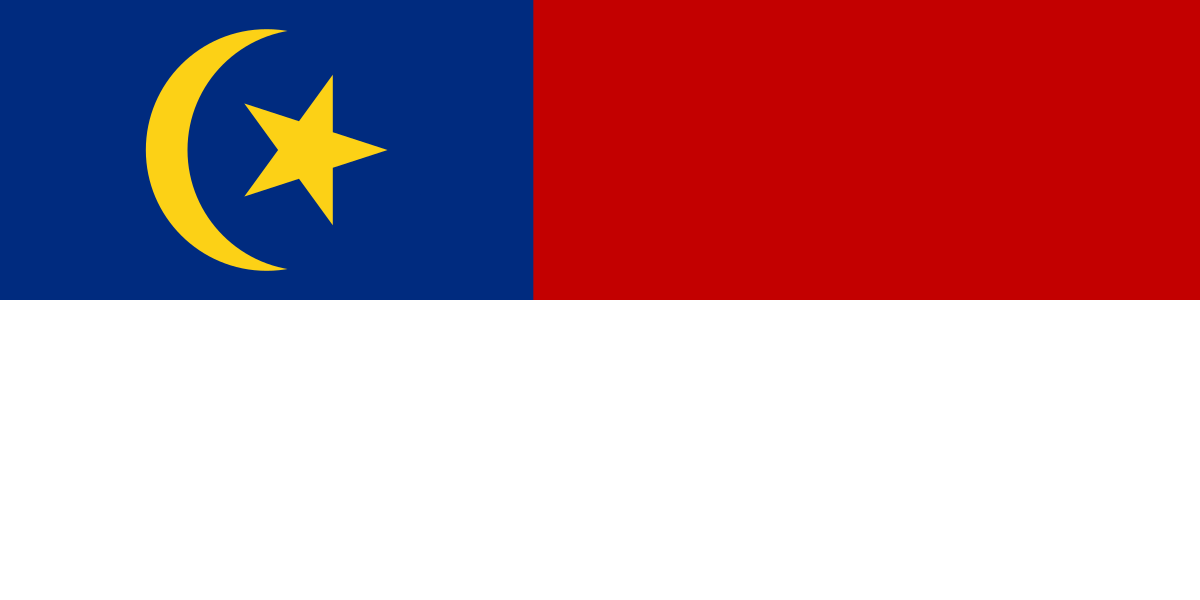
12Terengganu1.6K

13Melaka1.4K
14W.P. Putrajaya593
15Perlis408

16W.P. Labuan122
201520152022
MOHMinistry of Health MalaysiaValues: public-sector hospital beds
SourceMinistry of Health Malaysia ↗01 Sep 2024 · data through 2022HIGH CONFIDENCE
Method & notes
Hospital-bed counts provide a useful capacity view, but they should be read alongside population size and private-sector provision.
METHOD & LIMITATIONSHow the numbers were calculated
PulseKita filters the Ministry of Health hospital-bed dataset to state-level rows (All Districts) and the all-hospital-type total, then ranks states by active bed count.
- This dataset covers public-sector hospital beds and does not represent all private healthcare capacity.
- Bed counts are absolute capacity, not beds per capita; larger states will naturally tend to have more beds.
- The data reflects active beds as at 31 December of each year and is currently published through 2022.
Evidence trail
EVIDENCE CHAINtransformation inherited from methodology
- 1Primary evidenceHospital Beds by State and Hospital Type
- 2TransformationPulseKita filters the Ministry of Health hospital-bed dataset to state-level rows (All Districts) and the all-hospital-type total, then ranks states by active bed count.
- 3Published visualAnimated race
Source
HIGH CONFIDENCEofficial primary
COVERAGE2015 → 2022
UNITpublic-sector hospital beds
SOURCEmachine readable
UPDATED01 Sep 2024 · data through 2022