
PULSEKITA · PROUD MALAYSIA · INFOGRAFIK 15
Malaysia Then and Now
How much has Malaysia changed over roughly three decades? Six comparisons tell a story of development while reminding us that progress is not evenly experienced.
READING THE CHANGES
More than a changing skyline
A useful comparison keeps metrics consistent and years explicit. Four indicators use World Bank time series, population uses the official OpenDOSM national series, and rail uses historical milestones from the Ministry of Transport and MRT Corp. GDP per capita is not used as a proxy for salaries, home prices or purchasing power.
The achievements deserve recognition, but urbanisation brings congestion, Internet-use rates conceal connectivity gaps, and rising GDP per capita does not imply that each household shares equally in growth.
SIX COMPARISONS · DATA AND SOURCES
What actually changed?
This text article is independently readable and never used to assemble the six image pairs.
- 01Data series
Total population
Then · 199018.1 jutaNow · 202534.2 jutapeople
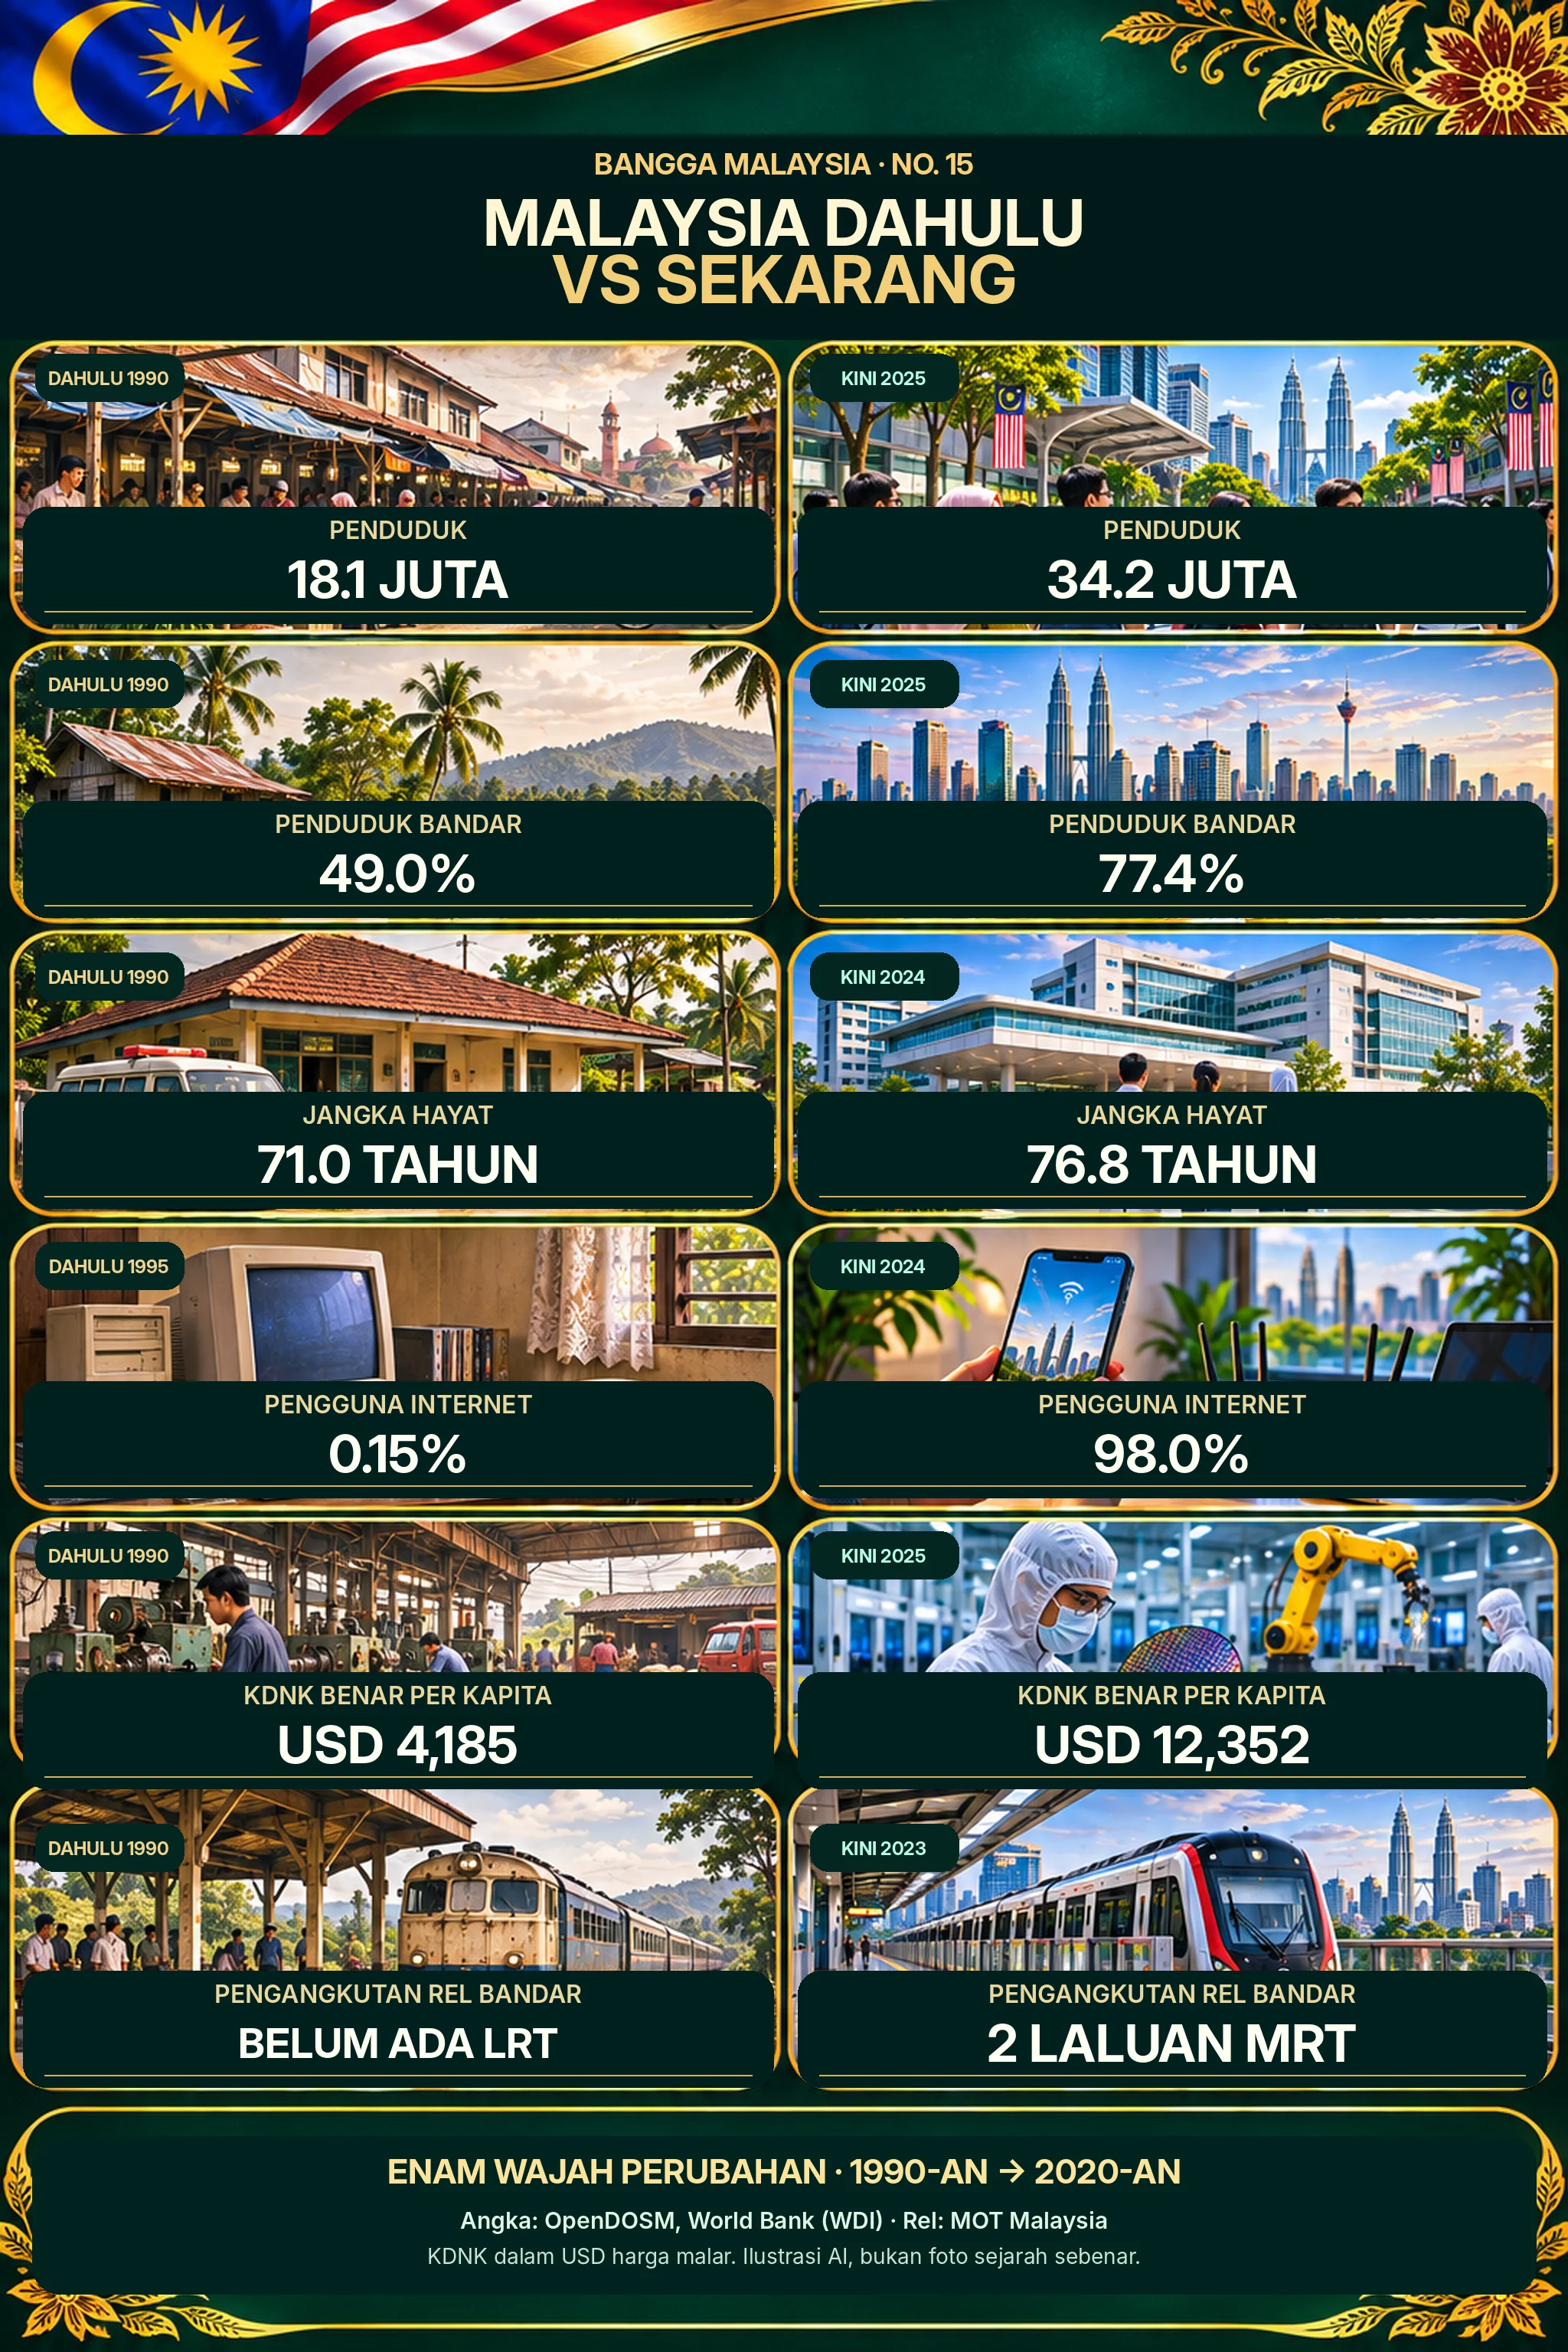
In the official OpenDOSM national population series, Malaysia had about 18.10 million people in 1990 and 34.22 million in 2025 (including estimated citizens and non-citizens). This shows a change in national scale, not proof that each individual is automatically better off. World Bank population estimates may differ owing to methodology and revisions.
- 02Data series
Urban population share
Then · 199049.0%Now · 202577.4%% of population
About 49.0% of Malaysia's population lived in officially classified urban areas in 1990, compared with roughly 77.4% in 2025 in the World Bank/UN series. Urban definitions may change, and urbanisation also brings challenges including traffic and housing costs.
- 03Data series
Life expectancy at birth
Then · 199071.0 tahunNow · 202476.8 tahunyears
World Bank data show life expectancy at birth rising from 70.95 years in 1990 to 76.82 in 2024. This is a population-wide measure using mortality rates at different ages, not a precise prediction of an individual's lifespan.
- 04Data series
Individuals using the Internet
Then · 19950.15%Now · 202498.0%% of population
In 1995, Internet access was new for most Malaysians: 0.146% were recorded as users. The World Bank/ITU measure reached 98.02% in 2024. It does not mean everyone has equally fast or reliable connectivity.
- 05Data series
Real GDP per capita
Then · 1990USD 4,185Now · 2025USD 12,352constant US dollars, same series
World Bank constant-price GDP per capita was about US$4,185 in 1990 and US$12,352 in 2025. Using a single constant-price series avoids comparing unadjusted nominal dollars. GDP per capita is not median wages, household income or a measure of inequality.
- 06Historical milestones
Urban rail milestones
Then · 1990Belum ada LRTNow · 20232 laluan MRTinfrastructure milestones, not equivalent numeric quantities
Malaysia did not yet have an operating urban LRT in 1990: STAR LRT launched in December 1996. By March 2023, the Klang Valley had launched both the Kajang and Putrajaya MRT lines. These are two historical milestones, not a like-for-like count of all rail lines or evidence that congestion disappeared.