
← Stories Department of Statistics Malaysia (DOSM)domestic tourism receipts · RM billion
IN BRIEF
TOURISM · RECEIPTS · STATES
Which Malaysian states earn the most from domestic tourism?
Compare domestic tourism receipts across all Malaysian states and federal territories in 2024 and 2025.
SHOW ME THE DATA2024 → 2025 · domestic tourism receipts · RM billion
ENTITY20242025CHANGE
W.P. Kuala Lumpur14.1→16.9+2.8
Selangor14.2→15.8+1.6

Pahang8.7→9.8+1.1

Sabah8.6→9.8+1.2

Sarawak8→9.1+1.1

Johor7.8→8.7+0.9

Melaka7.9→8.7+0.8

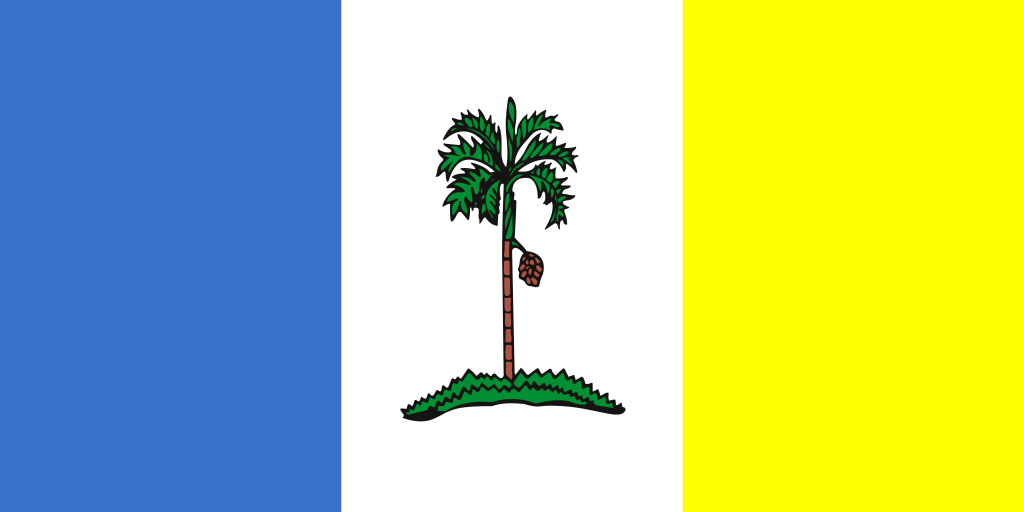
Pulau Pinang7.4→8.5+1.1
Perak7.2→8+0.8

Negeri Sembilan5.9→6.5+0.6

Terengganu5.2→5.8+0.6

Kedah5→5.5+0.5

Kelantan4.5→5.2+0.7

Perlis1→1.2+0.2

W.P. Putrajaya0.9→1.2+0.3
W.P. Labuan0.3→0.4+0.1
Department of Statistics Malaysia (DOSM)domestic tourism receipts · RM billionSourceDepartment of Statistics Malaysia (DOSM) ↗15 Sep 2026 · reference year 2025HIGH CONFIDENCE
Method & notes
Tourism receipts show the economic footprint of domestic travel and help distinguish high-volume destinations from high-spend destinations.
METHOD & LIMITATIONSHow the numbers were calculated
PulseKita reproduces DOSM's published state-level domestic tourism receipts from the Domestic Tourism Survey (States) for 2024 and 2025.
- Tourism receipts cover domestic visitor expenditure and are not the same as state government revenue.
- Higher receipts can reflect visitor volume, trip length and spending patterns.
- The figures are survey estimates and should be interpreted using DOSM's published Domestic Tourism Survey methodology.
Evidence trail
EVIDENCE CHAINtransformation inherited from methodology
- 1Primary evidenceDomestic Tourism Survey (States) 2025
- 2TransformationPulseKita reproduces DOSM's published state-level domestic tourism receipts from the Domestic Tourism Survey (States) for 2024 and 2025.
- 3Published visualBefore / after
Source
HIGH CONFIDENCEofficial primary
COVERAGE2024 → 2025
UNITdomestic tourism receipts · RM billion
SOURCEofficial publication
UPDATED15 Sep 2026 · reference year 2025